Market Monday: October 14, 2024
Welcome to this week’s Market Monday report!
As October moves along, the real estate market remains active, with some shifting trends. Interest rates and limited inventory continue to shape the landscape, affecting both buyers and sellers. Whether you’re looking to buy or sell, staying updated on these changes can help you make the best decisions. Read on for the latest insights and how they might impact your next steps.
Market Pulse Summary:
Our latest Market Pulse report shows a noticeable softening in buyer competition as we move into fall. The average number of offers per listing has dropped from 1.9 to 1.3, and fewer offers are coming in above the list price, with only 37% compared to 64% last week. Buyers seem more cautious, as full inspections have surged to 64%, reflecting a shift toward more thorough due diligence.
While the data suggests a cooling market, this could be tied to rising interest rates, although that's speculative at this point. With the Federal Reserve meeting in early November, we may see a potential shift if rates decrease, possibly spurring renewed buyer activity.
For more details, check out the full Market Pulse report here.
📈 Market Implications:
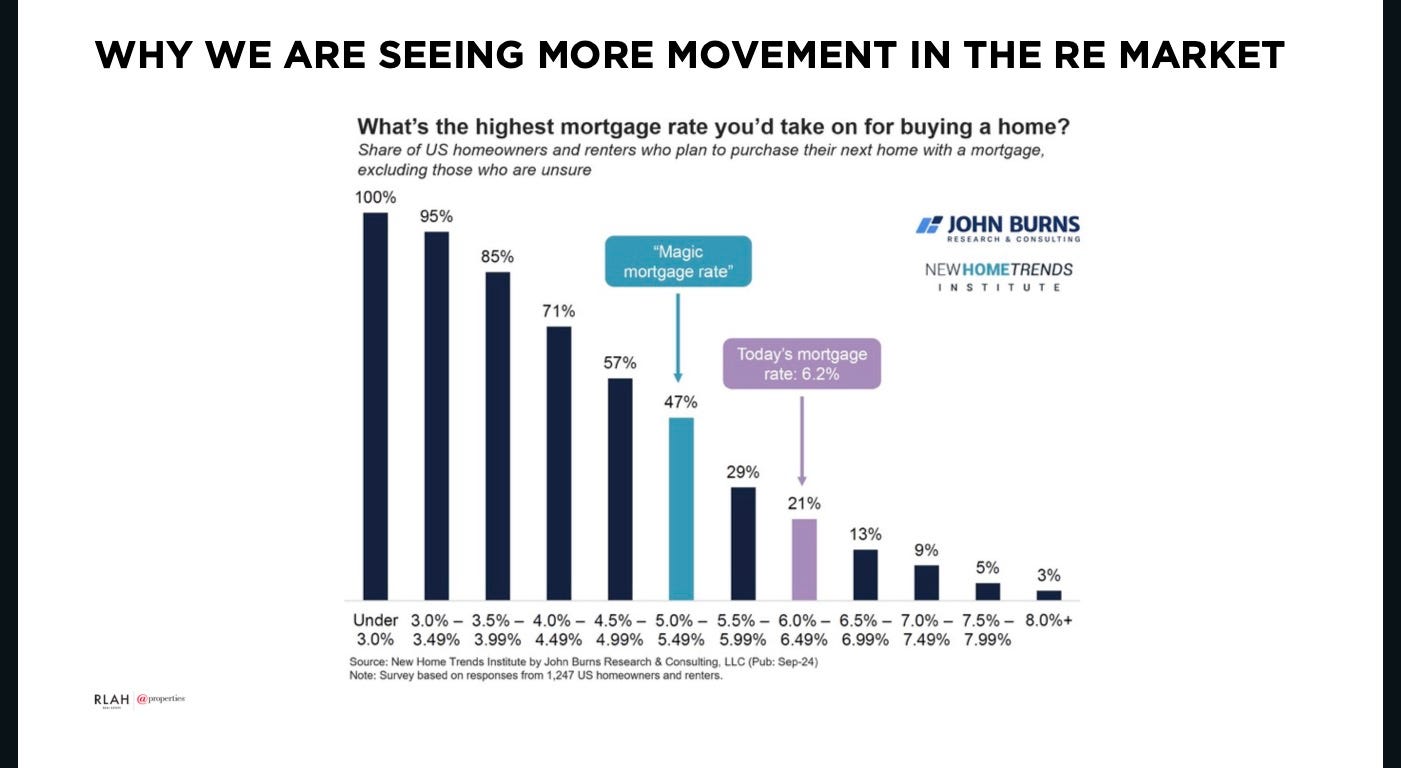
According to a recent survey, 47% of potential buyers are comfortable with mortgage rates up to 5.49%, but with today’s rates at 6.2%, only 21% are willing to move forward. This reluctance is likely contributing to the cooling market.
However, with inventory already low and expected to drop further as we approach the winter holiday season, buyers who remain active could face stiffer competition. While some may wait for lower interest rates after the Federal Reserve’s November meeting, those who delay might find fewer options and may have to wait until the spring market to find a property that fits their needs.
Presidential Effect
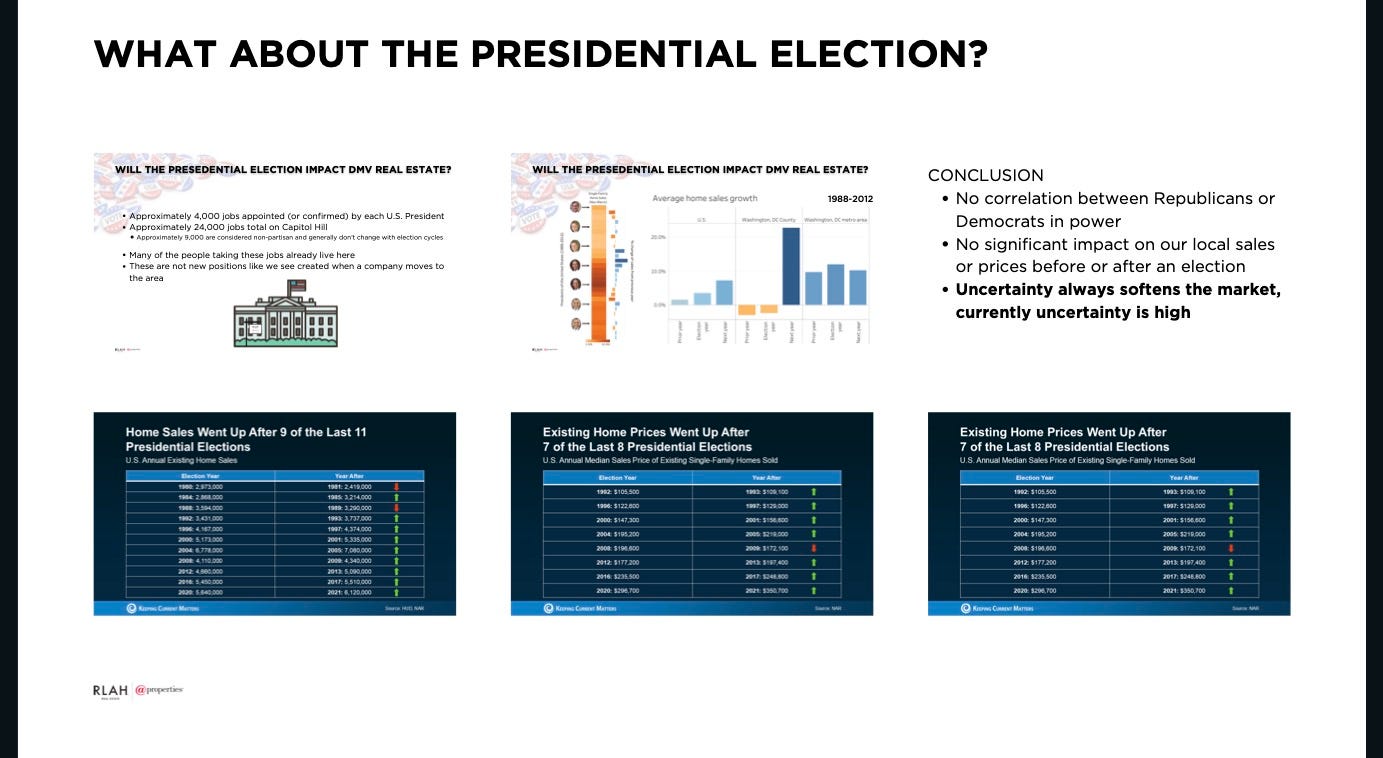
A reader and client recently asked me how the presidential election might be impacting the real estate market. Statistically, there is no clear correlation between elections and significant changes in local real estate sales or prices. Historical data shows no major shifts in market behavior tied directly to which party is in power. In fact, existing home prices have gone up after 7 out of the last 8 elections. The notable exception near an election was driven by deregulation and the housing crisis rather than election outcomes. While uncertainty during election periods can temporarily soften the market—and may even be contributing to current conditions—it doesn’t cause any substantial long-term impact.
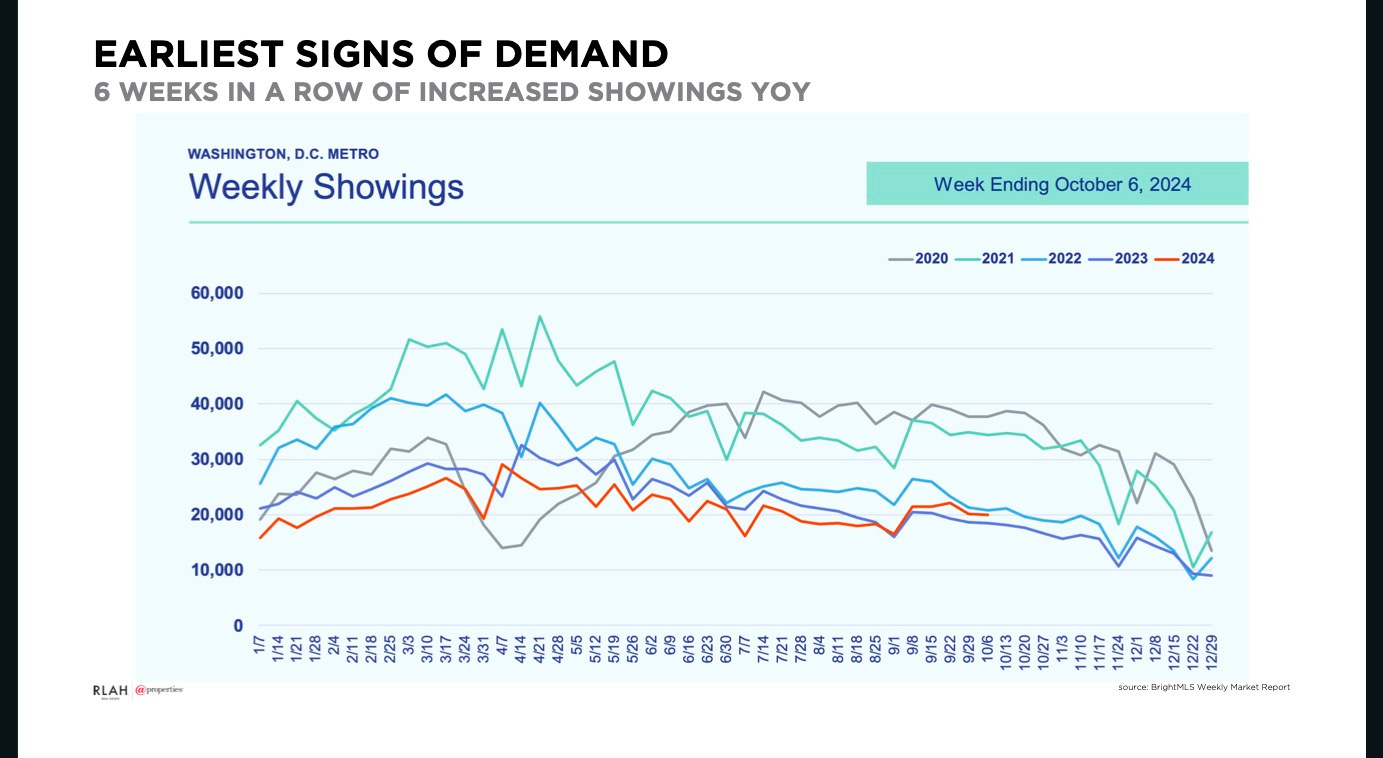
Early Signs of Demand: While I’m not predicting a surge in activity, recent data shows early signs of increased buyer interest. Showings have been up year-over-year for six consecutive weeks, indicating that while contracts may not yet reflect this, buyer activity is picking up compared to last year. With limited inventory and further decreases expected, the properties currently available are more likely to move. Buyers are aiming to secure deals before the holidays, which should keep the market active at least through Thanksgiving.
Let’s dive into this week’s data to see how these developments are impacting our local neighborhoods.
🏡 Bethesda, MD - Single-Family Homes
Median List Price: $2,295,861
Median Price of New Listings: $2,195,000
Price Per Square Foot: $494
Average Days on Market: 78
Median Days on Market: 49
Price Decreased: 29% ⬇️
Price Increased: 2% ⬆️
Relisted: 15%
Inventory: 98
Median Rent: $4,500
Market Action Index (MAI): 47 (Strong Seller’s Market)
Market Analysis:
Bethesda's single-family home market remains a strong seller's market with an MAI of 47, slightly down from last month's 48. Inventory has increased to 98 homes, providing more options for buyers. The average days on market has risen to 78, with a median of 49 days, indicating that homes are taking longer to sell. With 29% of listings experiencing price decreases, sellers may need to adjust pricing strategies to attract buyers. The high median list price suggests that the market is saturated with luxury properties, which may be facing longer market times. Buyers might find increased negotiation opportunities, especially on higher-priced homes.
🏢 Bethesda, MD - Condos/Townhomes
Median List Price: $599,000
Median Price of New Listings: $324,450
Price Per Square Foot: $424
Average Days on Market: 61
Median Days on Market: 42
Price Decreased: 30% ⬇️
Price Increased: 0%
Relisted: 13%
Inventory: 23
Median Rent: $3,000
Market Action Index (MAI): 53 (Strong Seller’s Market)
Market Analysis:
The condo and townhome market in Bethesda is showing signs of cooling, with the MAI decreasing from 58 last month to 53. Inventory has decreased to 23 units, but demand appears to be softening. The average days on market is 61, with a median of 42 days, suggesting that properties are taking longer to sell. With 30% of listings experiencing price decreases and no price increases, sellers should consider revising their pricing strategies. Buyers may find more negotiating power and a greater selection of properties, especially among those that have been on the market longer.
🏡 Chevy Chase, MD - Single-Family Homes
Median List Price: $2,275,000
Median Price of New Listings: $2,072,000
Price Per Square Foot: $576
Average Days on Market: 71
Median Days on Market: 56
Price Decreased: 29% ⬇️
Price Increased: 0%
Relisted: 13%
Inventory: 38
Median Rent: $5,400
Market Action Index (MAI): 41 (Slight Seller’s Advantage)
Market Analysis:
Chevy Chase's single-family home market is showing signs of balance with an MAI of 41, the same as last month. Inventory has increased to 38 homes, providing more choices for buyers. The average days on market is 71, with a median of 56 days, indicating that homes are staying on the market longer. With 29% of listings experiencing price decreases and no price increases, sellers should be cautious with their pricing. The high median list price suggests that luxury homes may be facing longer sales cycles. Buyers may find increased opportunities for negotiation.
🏢 Chevy Chase, MD - Condos/Townhomes
Median List Price: $650,000
Median Price of New Listings: $475,000
Price Per Square Foot: $423
Average Days on Market: 106
Median Days on Market: 105
Price Decreased: 44% ⬇️
Price Increased: 0%
Relisted: 8%
Inventory: 25
Median Rent: $2,935
Market Action Index (MAI): 35 (Slight Seller’s Advantage)
Market Analysis:
The condo and townhome market in Chevy Chase is cooling, with the MAI decreasing from 37 last month to 35. Inventory has decreased to 25 units, but the average days on market has increased significantly to 106 days, with a median of 105 days. A high 44% of listings have experienced price decreases, indicating that sellers are adjusting to market conditions. Buyers may find increased negotiating power and a wider selection of properties, especially among those that have been on the market for an extended period.
🏡 Gaithersburg, MD - Single-Family Homes
Median List Price: $915,000
Median Price of New Listings: $879,000
Price Per Square Foot: $279
Average Days on Market: 75
Median Days on Market: 35
Price Decreased: 31% ⬇️
Price Increased: 5% ⬆️
Relisted: 3%
Inventory: 65
Median Rent: $2,990
Market Action Index (MAI): 54 (Strong Seller’s Market)
Market Analysis:
Gaithersburg's single-family home market remains strong with an MAI of 54, though down from last month's 56. Inventory has remained steady at 65 homes. The average days on market is 75, with a median of 35 days, indicating a mix of quick sales and longer listings. With 31% of listings experiencing price decreases, sellers should be mindful of competitive pricing. The high median list price suggests a focus on higher-end homes, which may take longer to sell. Buyers may find opportunities in negotiating prices, especially on homes that have been on the market longer.
🏢 Gaithersburg, MD - Condos/Townhomes
Median List Price: $459,000
Median Price of New Listings: $449,900
Price Per Square Foot: $280
Average Days on Market: 27
Median Days on Market: 21
Price Decreased: 27% ⬇️
Price Increased: 4% ⬆️
Relisted: 2%
Inventory: 48
Median Rent: $2,040
Market Action Index (MAI): 69 (Strong Seller’s Market)
Market Analysis:
The condo and townhome market in Gaithersburg is robust, with an MAI of 69, though slightly down from last month's 76. Inventory has decreased to 48 units, and properties are selling quickly, with an average days on market of 27 and a median of 21 days. With 27% of listings experiencing price decreases, sellers should still price competitively to attract buyers. Buyers should be prepared to act quickly in this fast-paced market.
🏡 Germantown, MD - Single-Family Homes
Median List Price: $750,000
Median Price of New Listings: $707,450
Price Per Square Foot: $251
Average Days on Market: 36
Median Days on Market: 28
Price Decreased: 51% ⬇️
Price Increased: 3% ⬆️
Relisted: 5%
Inventory: 37
Median Rent: $2,450
Market Action Index (MAI): 55 (Strong Seller’s Market)
Market Analysis:
Germantown's single-family home market remains strong with an MAI of 55, though down from last month's 62. Inventory has decreased to 37 homes. The average days on market is low at 36 days, with a median of 28 days, indicating that homes are selling relatively quickly. However, 51% of listings have experienced price decreases, suggesting that overpricing may be an issue. Sellers should be cautious with pricing and consider market trends. Buyers may find opportunities among homes with recent price reductions.
🏢 Germantown, MD - Condos/Townhomes
Median List Price: $419,900
Median Price of New Listings: $450,000
Price Per Square Foot: $275
Average Days on Market: 37
Median Days on Market: 21
Price Decreased: 33% ⬇️
Price Increased: 0%
Relisted: 2%
Inventory: 57
Median Rent: $1,987
Market Action Index (MAI): 69 (Strong Seller’s Market)
Market Analysis:
The condo and townhome market in Germantown is robust, with an MAI of 69, slightly down from last month's 73. Inventory has increased to 57 units. The average days on market is 37, with a median of 21 days, indicating quick sales. With 33% of listings experiencing price decreases, sellers should price properties appropriately. Buyers should be prepared to move quickly but may find opportunities among homes with price reductions.
🏡 Kensington, MD - Single-Family Homes
Median List Price: $1,325,000
Median Price of New Listings: $974,500
Price Per Square Foot: $404
Average Days on Market: 55
Median Days on Market: 21
Price Decreased: 30% ⬇️
Price Increased: 0%
Relisted: 13%
Inventory: 23
Median Rent: $3,345
Market Action Index (MAI): 57 (Strong Seller’s Market)
Market Analysis:
Kensington's single-family home market is heating up, with the MAI increasing from 50 last month to 57. Inventory has decreased to 23 homes, intensifying competition among buyers. The average days on market is 55, with a median of 21 days, showing that well-priced homes are selling quickly. With 30% of listings experiencing price decreases, sellers should ensure their pricing aligns with market expectations. Buyers should be prepared for a competitive market environment.
🏡 Potomac, MD - Single-Family Homes
Median List Price: $2,147,500
Median Price of New Listings: $1,434,997
Price Per Square Foot: $348
Average Days on Market: 114
Median Days on Market: 63
Price Decreased: 28% ⬇️
Price Increased: 2% ⬆️
Relisted: 9%
Inventory: 54
Median Rent: $5,250
Market Action Index (MAI): 46 (Strong Seller’s Market)
Market Analysis:
Potomac's single-family home market remains a strong seller's market with an MAI of 46, slightly up from last month's 44. Inventory has held steady at 54 homes. The average days on market is high at 114 days, with a median of 63 days, indicating that homes, especially in higher price ranges, are taking longer to sell. With 28% of listings experiencing price decreases, sellers should be cautious with pricing strategies. The high median list price suggests a market saturated with luxury homes. Buyers may find opportunities for negotiation, particularly on properties that have been on the market longer.
🏡 Rockville, MD - Single-Family Homes
Median List Price: $727,450
Median Price of New Listings: $632,000
Price Per Square Foot: $345
Average Days on Market: 41
Median Days on Market: 25
Price Decreased: 35% ⬇️
Price Increased: 3% ⬆️
Relisted: 10%
Inventory: 62
Median Rent: $3,525
Market Action Index (MAI): 65 (Strong Seller’s Market)
Market Analysis:
Rockville's single-family home market remains robust with an MAI of 65, up from 63 last month. Inventory has decreased to 62 homes, intensifying competition. The average days on market is 41, with a median of 25 days, indicating that homes are selling relatively quickly. With 35% of listings experiencing price decreases, sellers should price competitively. Buyers should be prepared to act swiftly but may find negotiation opportunities on homes with price reductions.
🏢 Rockville, MD - Condos/Townhomes
Median List Price: $553,999
Median Price of New Listings: $434,950
Price Per Square Foot: $328
Average Days on Market: 79
Median Days on Market: 63
Price Decreased: 22% ⬇️
Price Increased: 6% ⬆️
Relisted: 14%
Inventory: 79
Median Rent: $2,521
Market Action Index (MAI): 41 (Slight Seller’s Advantage)
Market Analysis:
The condo and townhome market in Rockville is cooling, with the MAI decreasing from 44 last month to 41. Inventory remains steady at 79 units. The average days on market is 79, with a median of 63 days, suggesting a slower sales pace. With 22% of listings experiencing price decreases, sellers should adjust pricing strategies accordingly. Buyers may find increased opportunities and negotiation power, especially on properties that have been on the market longer.
🏡 Silver Spring, MD - Single-Family Homes
Median List Price: $675,000
Median Price of New Listings: $627,450
Price Per Square Foot: $309
Average Days on Market: 51
Median Days on Market: 28
Price Decreased: 37% ⬇️
Price Increased: 3% ⬆️
Relisted: 9%
Inventory: 156
Median Rent: $3,000
Market Action Index (MAI): 57 (Strong Seller’s Market)
Market Analysis:
Silver Spring's single-family home market remains strong with an MAI of 57, though down from last month's 62. Inventory has increased to 156 homes, offering more choices for buyers. The average days on market is 51, with a median of 28 days, indicating a mix of quick sales and longer listings. With 37% of listings experiencing price decreases, sellers should be mindful of market pricing. Buyers may find opportunities among homes with price reductions or longer days on market.
🏢 Silver Spring, MD - Condos/Townhomes
Median List Price: $350,000
Median Price of New Listings: $370,000
Price Per Square Foot: $264
Average Days on Market: 60
Median Days on Market: 35
Price Decreased: 36% ⬇️
Price Increased: 1% ⬆️
Relisted: 12%
Inventory: 75
Median Rent: $2,020
Market Action Index (MAI): 56 (Strong Seller’s Market)
Market Analysis:
The condo and townhome market in Silver Spring remains a strong seller's market with an MAI of 56, unchanged from last month. Inventory has decreased to 75 units. The average days on market is 60, with a median of 35 days, showing a balanced pace of sales. With 36% of listings experiencing price decreases, sellers should consider competitive pricing. Buyers have opportunities for negotiation, especially on properties that have been listed longer or have had price reductions.
Key Takeaways:
Interest Rate Impact: As interest rates hover around 6.2%, buyer willingness has dipped, with only 21% of buyers comfortable moving forward. This has contributed to softening demand, though the effects are not felt equally across all neighborhoods.
Segmented Market Behavior: While higher-end areas like Bethesda and Potomac may experience longer market times due to pricing and inventory shifts, other areas with more moderately priced homes, like Germantown and Gaithersburg, remain strong seller's markets with quicker sales activity.
As we head deeper into fall, the real estate market remains in flux, shaped by rising interest rates, limited inventory, and varying neighborhood dynamics. Buyers looking to take advantage of current opportunities should act sooner rather than later, as competition is expected to increase with further inventory drops leading into the winter holiday season. For sellers, pricing your home correctly remains crucial in this market, especially in neighborhoods where higher-end properties are taking longer to move.
If you're considering buying or selling and want a personalized assessment of how these trends impact your local market, feel free to reach out at 301-564-3058 or Corey@FeldmanGroupRe.com. Let's strategize the best approach for your real estate goals in this evolving market!


